

The 2026 midterm elections brought sweeping change to America’s political landscape, with Democrats securing sizable majorities in both chambers of Congress. While Republicans mostly evaded disaster in traditionally deep-red Knox County, the national political environment fueled a surge in turnout that shifted the county more than 20 points toward Democrats.
That shift was foreshadowed in the August elections in which Democrats narrowed margins across the county, flipping a County Commission seat and securing a majority on the School Board. In November, Democrats flipped a state House seat and narrowed margins even further, while Republicans managed to avoid further losses in races that were far more competitive than they are accustomed to.
But the wins and losses don’t fully explain what happened. Precinct-level results offer a more detailed picture. What follows is a closer look at how the electorate changed, where it changed and—to the extent the data can tell us—why.
A note on scope: Unless otherwise noted, all figures in this analysis reflect Knox County votes only. Because many state and federal districts extend beyond county boundaries, the results presented here do not necessarily reflect districtwide outcomes.
Countywide Results
In Knox County, Republicans squeaked out wins in both head-to-head federal races, while Democrats won a plurality in the governor’s race and flipped state House District 18.
Statewide, Sen. Marsha Blackburn won the governor’s race by a margin of 45.5% to 42.9%, with conservative independent David Hatley at 9.3%, but lost Knox County by a 6.1 point margin. Democrat Jerri Green dominated the city core and North Knoxville, which saw some of the largest swings toward Democrats, while Blackburn held the rural north and east and the western suburbs by strong margins.
Incumbent Rep. Burchett easily won the 2nd District with 57.7% across the entire district, while narrowly defeating Democrat Michaela Barnett by just 0.8 points in Knox County. That race shows the county’s near tie more clearly: like Green, Democrat Michaela Barnett carried the city core, North Knoxville and the west-central corridor, while Burchett held Farragut and the rural North and East Knox County precincts by wide margins.
How Big Was the Shift?
Exactly how big the shift towards Democrats was depends on which races you compare, but it was at least the largest in a generation. The fairest estimate puts the shift somewhere between 16 and 21 points. The governor’s race shows an even larger swing, though most of that excess reflects Blackburn losing Republican votes to conservative independent candidate David Hatley, who took 7.2% of the vote countywide.
When compared to past election cycles, every race moved in the same general direction: Republican margins of roughly 15 to 25 points from 2018 through 2024 collapsed to near zero in 2026, with the governor’s race falling furthest. The 2026 decline wasn’t necessarily a continuation of a trend, either: Donald Trump’s margin in Knox County grew from 15 points in 2020 to 19.5 in 2024. Nor was it a typical midterm swing: in 2018, also a midterm under President Trump, Burchett carried Knox by 22.5 points.
The 2026 rematch between incumbent Sen. Bill Hagerty and Democrat Marquita Bradshaw is the cleanest comparison: Hagerty defeated Bradshaw in Knox County by 20.2 points in 2020 (59.3% to 39.1%) and by 1.9 in 2026, an 18.3-point swing with the same two candidates. Bradshaw drew 75,557 votes in 2026, 89% of her 2020 total of 84,847, even though only about 71% as many people voted. Hagerty received 78,503, just 61% of his 2020 total. In other words, the raw number of Democratic votes in 2026 stayed close to presidential-year levels while the Republican vote fell by about two-fifths. Margins in the U.S. House race between 2022 and 2026, both midterm elections, moved in the same direction.
Where the Shift Happened
Every single Knox County precinct moved toward Democrats in 2026, but the size of the shift varied, with the largest Democratic gains in precincts that were competitive to begin with and the smallest at the partisan extremes.
North Knoxville moved most. About half of the 20 precincts that flipped from Burchett to Barnett were in North Knoxville precincts: Inskip Rec Center went from Burchett +15.8 to Barnett +20.4, Richard Yoakley from Burchett +5.2 to Barnett +27.2, and West Haven from Burchett +7.0 to Barnett +23.2.
The west-central suburbs flipped narrowly. Ridgedale, Bearden Middle, Cedar Bluff Middle and Ball Camp all flipped; Ball Camp went from Burchett +21.4 to Barnett +1.0.
Some outer-county precincts swung hard but held. Ebenezer in West Knoxville went from Burchett +37.3 to +5.6, Crown College in Powell from +42.1 to +12.1, and Arminda in East Knoxville from +32.9 to +2.9.
Republican and Democrat strongholds moved least. Farragut High went from Burchett +43.8 to +28.7, and Gibbs, Corryton and Copper Ridge each stayed above Burchett +45. In East Knoxville, Phyllis Wheatley, Fair Garden and Austin-East moved only 8 to 12 points, largely because they were already 60 to 74 points Democratic.
Who Votes for Whom in Knox County
Before digging too deep into what changed, it’s worth better understanding which parts of Knox County lean Republican and which lean Democratic, regardless of the year.
The chart below ranks Knox County precincts with at least 200 votes by demographic and economic characteristics, and then divides them into five roughly equal groups. These “fifths,” or quintiles, make it easier to compare voting patterns from one end of the range to the other—for example, from precincts with the lowest household incomes to those with the highest. Each bar shows the group’s 2026 U.S. House margin.
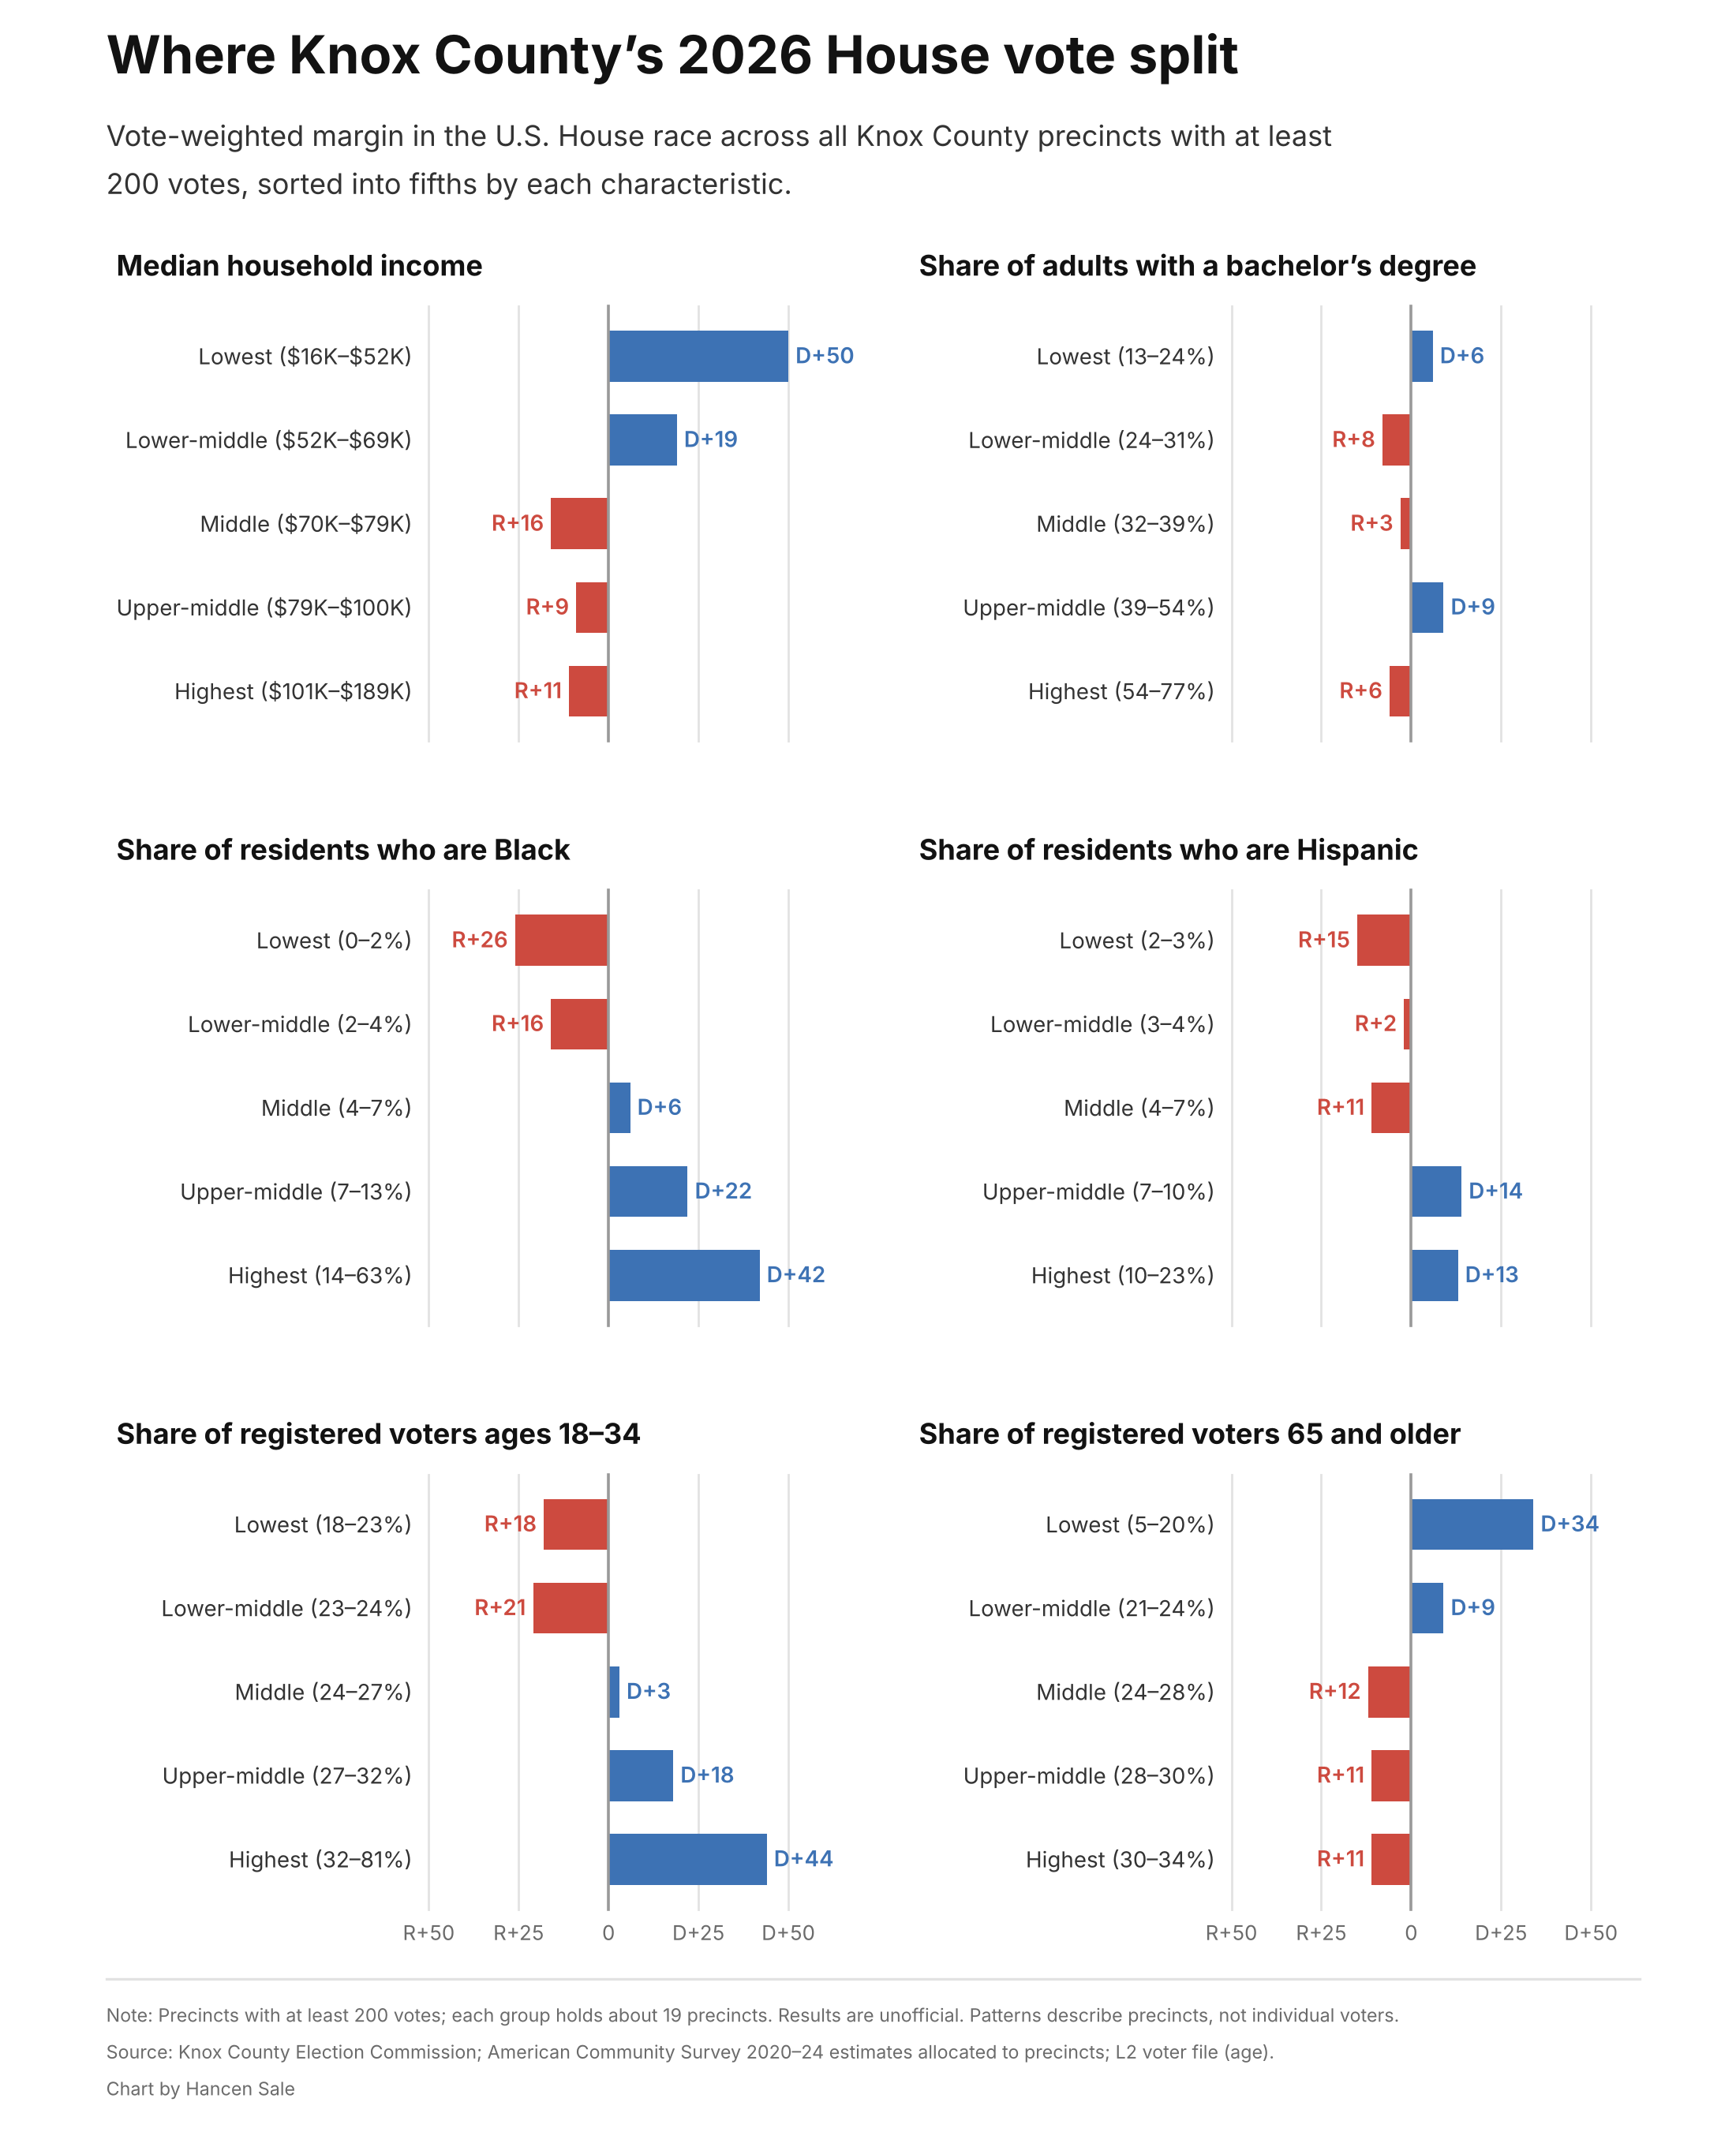
Race is the single strongest predictor. The pattern is remarkably smooth: precincts where fewer than 2% of residents are Black voted Republican by 26 points, while those where Black residents make up 14% or more voted Democratic by 42 points. That largely reflects East Knoxville, where Democrats routinely win by 60 points or more. Precincts with larger Hispanic populations also lean Democratic, by about 13 to 14 points in the top two fifths, though the pattern is less consistent and Hispanic residents make up a much smaller share of the county’s population.
Income matters—but only up to a point. The lowest-income fifth of precincts, with median household incomes below about $52,000, voted Democratic by 50 points, and the next fifth by 19. Above roughly $70,000, though, the relationship flattens: the top three fifths all voted Republican, by 9 to 16 points, with the wealthiest precincts no more Republican than the middle.
Education is the interesting one. On its own, a precinct’s share of college graduates tells you almost nothing about how it votes. That’s because education and income tend to be related. Holding income and race constant, more college-educated precincts lean noticeably more Democratic; holding education constant, wealthier precincts lean more Republican. In other words, the most Republican precincts in Knox County tend to be higher income but less college-educated, while affluent precincts with a lot of college graduates are far more mixed.
Age and voting habits matter too. Precincts with the most eligible voters ages 18 to 34 voted Democratic by 44 points, while those with the fewest voted Republican by about 20. By contrast, precincts with the fewest voters 65 and older leaned strongly Democratic, while those with older populations voted Republican by about double-digits. The most reliable voters—precincts with the highest 2024 turnout—also lean Republican, which helps explain why low-turnout midterms have historically favored Knox County Republicans, and why 2026 broke that pattern.
Added Voters, Not Missing Republicans
One of the most common explanations for a wave election, especially a midterm, is that the losing party’s voters simply stayed home. But data suggest that wasn’t the case in 2026. Compared with the 2022 midterm, the total number of Republican votes was remarkably steady. It was the Democratic vote that grew.
Turnout of voting-aged citizens rose from an estimated 34% in 2022 to 42% in 2026, by a similar 6 to 9 points in Democratic and Republican precincts alike. Democrats did not win by running up turnout in their strongholds. They instead won by adding to vote totals inside traditionally Republican territory: precincts Burchett carried in 2022 supplied three-quarters of Barnett’s gain, while Burchett gained ground only in the most Republican precincts—and even there Barnett gained nearly four times as many votes.
Turnout rose almost everywhere. The voter file gives us an idea of who these added voters were. About 93,600 more people voted in 2024 than in 2022, a pool of presidential-year voters who skip midterms; the 28,800 added 2026 voters equal about 31% of that pool of voters who typically vote in presidential-year elections but skip the midterms. Precinct totals cannot show whether some 2022 Republican voters also switched sides or whether new voters replaced them, but it is likely a little bit of both.
Put simply, Republicans turned out at about the same rate as a typical midterm election, while Democrats turnout like it was a presidential-year election.
Who Moved—and Who Didn’t
Among Republican-leaning precincts, the largest swings didn’t come in affluent, college-educated suburbs, as one might expect. They instead came in places where turnout is usually low. Each dot in the scatter below is one of the 63 precincts Burchett carried in 2022; the farther left a precinct sits (lower 2024 turnout), the more it tended to swing toward Democrats.
Income and education show the same pattern, less sharply. Lower-income precincts (median household income $39,000–$76,000) moved 24.4 points, versus 20.1 in higher-income ones ($93,000–$189,000). However, historical voter turnout mattered more than anything. Gibbs has one of the county’s lowest college-graduation rates but high turnout, and moved only 17.6 points. Inskip Elementary, with 64% turnout in 2024 and a median income near $52,000, moved 29.6. Farragut Middle, with a median income near $155,000 and high turnout, moved 19.7.
Marsha’s Hatley Problem
Blackburn didn’t lose Knox County because Jerri Green won over new voters. She lost it because a significant number of Republican-leaning voters chose conservative-leaning independent David Hatley instead: on the same ballot, Blackburn ran about 11,900 votes behind Hagerty, while Green finished within 800 votes of the other two Democrats. Knox voters have treated Blackburn this way before—in 2018 she carried the county by just 3.1 points against Phil Bredesen while Bill Lee won it by 16.6 and Burchett by 22.5, and in 2024 she ran 6.6 points behind Burchett.
The pattern across precincts tells you who Hatley’s voters were. Blackburn’s shortfall grew steadily with a precinct’s share of Republican voters—largest in places like Gap Creek, where Hagerty won 68.0% to her 52.8%—while Green ran even with the other Democrats everywhere. Hatley drew Republicans, so Blackburn lost the most votes where there were the most Republican votes to lose.
Measured proportionally, though, the rate of defection was fairly even countywide—about 15% of Hagerty’s vote—and if anything slightly higher in the city (25% at Sequoyah) than in Farragut or Halls (closer to 10%). Republican-heavy precincts account for most of the lost votes only because they hold most of the county’s Republicans, not because rural voters revolted.
Estimating a defection rate. It’s fairly clear that Blackburn lost the most ground in reliably Republican precincts. The question is how many. A statistical technique called ecological regression can give us a decent estimate. In Knox County, precincts where Bill Hagerty received more votes also tended to give David Hatley more votes, while Democrat Marquita Bradshaw’s stronger precincts showed little change in Hatley’s support. Comparing those patterns across roughly 100 precincts makes it possible to estimate how each Senate candidate’s voters split in the governor’s race.
The results suggest an estimated 87% of Hagerty’s voters backed Blackburn, 11% backed Hatley and 2% backed Green, a defection rate of roughly 13%. Bradshaw’s voters were far more loyal: nearly all appear to have backed Green, and only about 3% backed Hatley. That means roughly three-quarters of Hatley’s 11,300 votes, about 8,700, likely came from Hagerty voters, and about 2,200 from Bradshaw voters.
Every scenario lands within about 2 points of the Senate and House results, so without Hatley the governor’s race would likely have been close. Using the estimated defection rate, Green would still have narrowly carried the county; under assumptions more favorable to Blackburn, she would have won outright.
Did Newcomers Drive the Shift? Probably Not
One theory is that the shift toward Democrats was driven by newcomers—people moving to Knox County from bluer parts of the country. But data doesn’t support that theory. According to census estimates, Knox County added about 19,000 voting-age citizens between 2020 and 2024 census estimates, a 5.3% increase. Yet precincts that lost residents swung toward Democrats just as much as the fastest-growing ones. Plotted precinct by precinct, the relationship between population growth and the swing to Democrats is essentially flat.
The fastest-growing precincts, such as Hardin Valley, Arminda and Ball Camp, produced about 1,850 more Democratic votes than shrinking ones, but Burchett gained votes in those areas too. Across the county, population growth accounts for an estimated net Democratic gain of well under 1,000 votes, against a roughly 26,000-vote change in the House margin.
House District 18: Davis (R) vs. Goldberg (D)
State House District 19 largely followed countywide patterns. Incumbent Rep. Elaine Davis won by 8.2 points over Democrat Greg Kaplan in 2022 and by 7.5 over Democrat Bryan Goldberg in 2024, carrying the same 11 of 14 precincts both times. In 2026, Goldberg won 55% to 45%, an 18.3-point swing from 2022, and carried 10 of the districts 11 precincts.
Davis’s vote total barely moved, from 11,604 in 2022 to 11,452; Goldberg won by drawing 4,200 more votes than Kaplan. The northern precincts drove the result: Ridgedale went from Davis +5.8 to Goldberg +22.0, and Pleasant Ridge from Davis +6.0 to Goldberg +19.2. Sequoyah Elementary, already the district’s most Democratic precinct, moved least. Davis held only South Doyle, where her margin fell from 45.4 points to 23.1.
Comparing raw 2026 totals with 2024 makes both candidates look weaker, because District 18 turnout fell 26.5% from the presidential year: Davis lost about 7,200 votes and Goldberg about 2,000. Comparing midterm with midterm avoids that distortion. Against 2022, Davis’s vote was essentially flat (11,604 versus 11,452) while the Democratic vote rose from 9,846 to 14,020, so the result reflects Democratic gains more than Republican losses.
Other Races Followed the Same Pattern
State House District 18 was the only Knox County legislative seat to flip from Republican to Democratic control, though it was not an outlier. Every contested race that can be compared with 2022 swung 17 to 22 points toward Democrats, about the same as the U.S. House race.
Two results stand out: In Senate District 7, Knox County’s largest legislative district, incumbent Sen. Richard Briggs’s rematch with Democrat Bryan Langan narrowed from nearly 25 points to about 5. In Senate District 5, an open seat vacated by retiring Lt. Governor Randy McNally, Democrat David Miller narrowly led in the district’s Knox County portion, 10,699 to 10,447, though Matlock carried the district with strong margins in the Anderson County and Loudon County portions of the district.
The City Charter Amendment
The City Charter Amendment—which allows City Council candidates who win an outright majority in the primary to skip the runoff—passed by just 604 votes. Support for the amendment ran east to west.
Deane Hill, which Blackburn nearly carried, was among the amendment’s strongest precincts, while East Knoxville precincts where Green topped 80% were among its weakest. Across city precincts, support rose with median income and education and fell with the share of Black residents. However, holding income constant, there was virtually no difference between precincts by race. About 1 in 10 city voters, roughly 5,000 people, skipped the question, more than eight times the margin.
The extraordinary close margin was similar to the 2024 city charter amendment, when Knoxville voters rejected a proposal to make all City Council seats at-large, 51% to 49%, along similar demographic lines.
What the Statistical Models Say
The findings above rest mostly on simple comparisons, so I applied some statistical models to the same precinct data to dig a little deeper. The results largely reinforce the central conclusions above.
A voter-transition model confirms the turnout story. The ballot is secret, so there’s no way to know exactly who switched sides. But the same ecological regression used before can give us a general idea. Think of each precinct as a separate experiment: if Burchett’s 2022 voters had been abandoning him, his 2026 vote should fall most in the precincts where his 2022 vote was concentrated. By comparing how each candidate’s 2026 support rises and falls against the 2022 results across every precinct, the model can estimate where each group’s votes most likely went.
The model estimates about 93% of Burchett’s 2022 voters voted for him again, roughly 7% switched to Democrat Michaela Barnett, and essentially none stayed home. The Democratic nominee’s 2022 voters stayed almost entirely Democratic. And among those who didn’t vote in 2022, about 20,400 voted for Barnett in 2026 against roughly 4,900 for Burchett—a four-to-one Democratic edge among new and irregular voters.
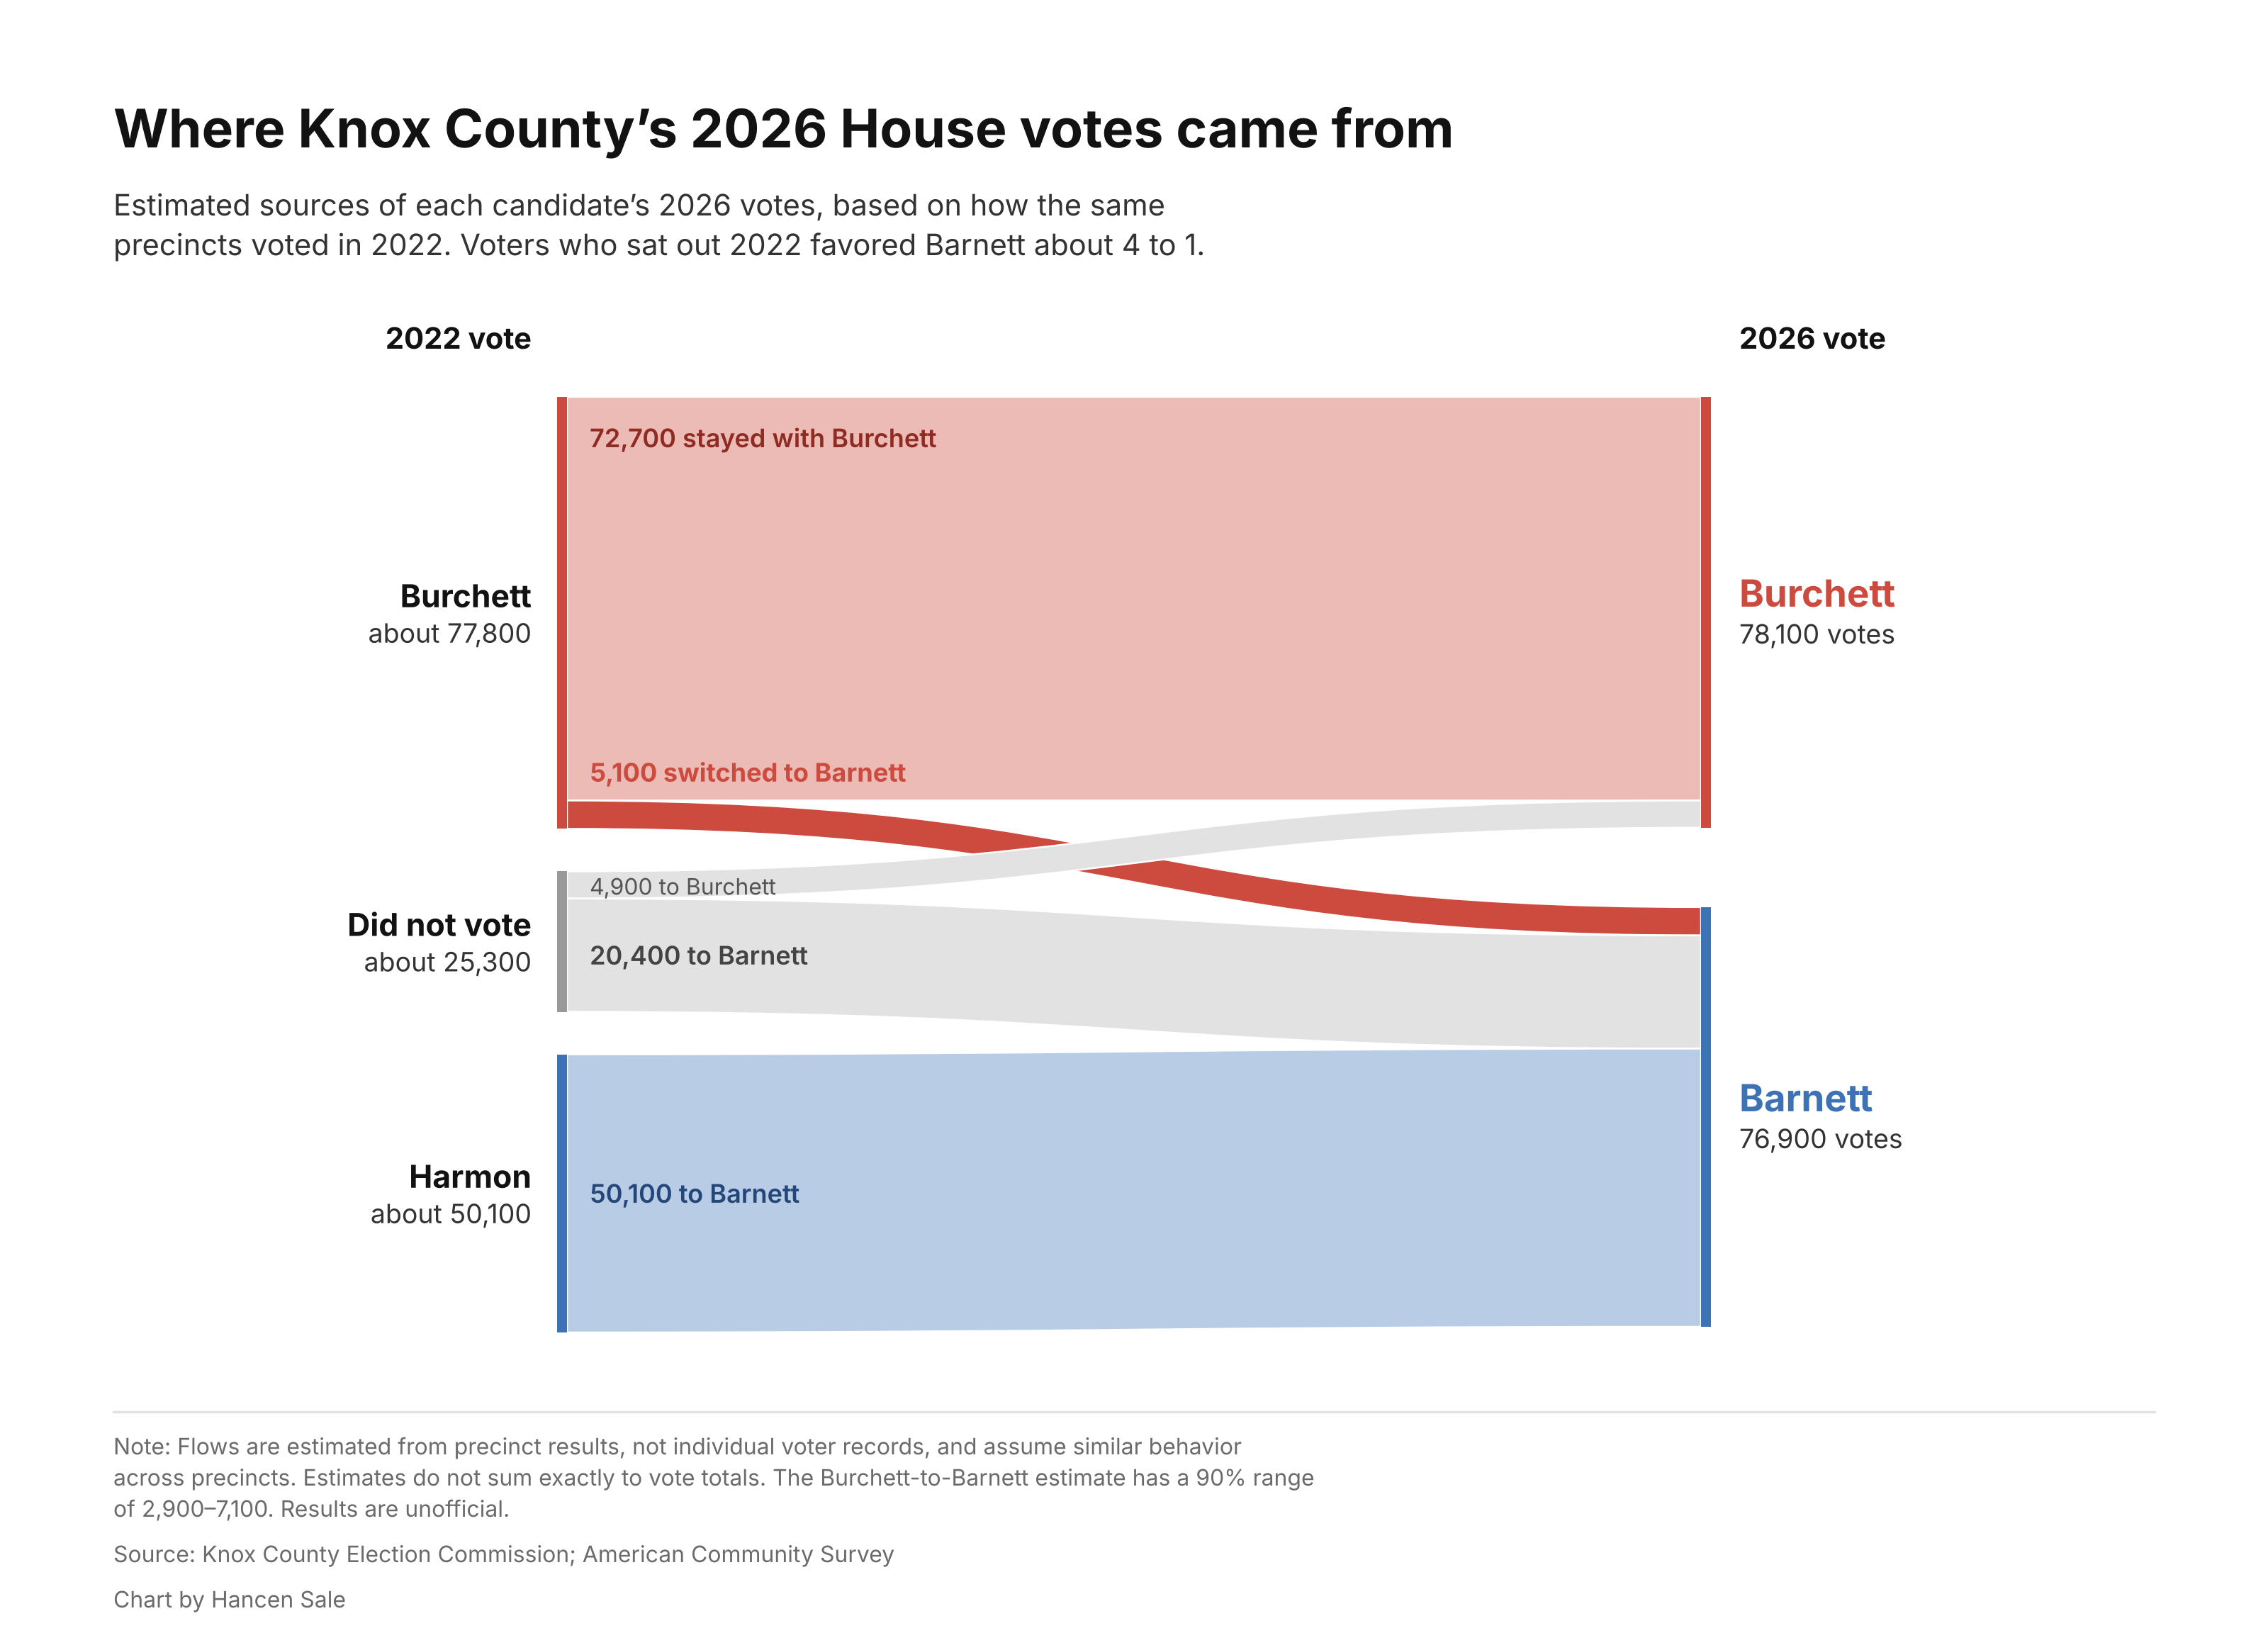
Ticket-splitting outside the governor’s race was minimal. Applying the same model to the Senate and House races on the same November ballot suggests about 99% of Hagerty’s voters also voted for Burchett and nearly all of Bradshaw’s voted for Democrats. In the head-to-head races, Knox County voted the party line; the governor’s race—where about 13% of Hagerty’s voters chose Hatley instead of Blackburn—was the exception.
A five-type map of Knox County. As a final way of seeing the county results whole, I used a machine learning algorithm known as k-means clustering to group precincts exclusively by income, education, race, age, turnout habits and 2022 partisanship. The result is five different groups (I came up with the names afterwards).
The middle-income city neighborhoods is largely where the election was decided: they moved the most, hold a third of the county’s precincts and flipped from lean to solid-Democrat, while the affluent suburbs went from safe Republican territory to single digits.
The map above shows how the clusters are demographic, not strictly geographic: a handful of city precincts like Sequoyah Hills and Bearden Elementary sort with the affluent suburbs, because statistically they are more similar to suburban areas than traditional city precincts.
Looking Ahead: Two 2028 Scenarios
The analysis above describes what happened. But what do the results mean for the upcoming elections in 2028?
Which seats are in play? To put each legislative district on a common scale, I measured its partisan lean by the two-party U.S. House margin inside its precincts, allocating split precincts by the ballots cast in each district’s own race. In every contested 2026 state House race, the U.S. House result lands within about two points of the actual result. On that scale, the 2026 shift pulled three Republican-held seats toward competitive territory, though Republicans still maintain a considerable advantage. District 18 flipped outright in 2026. Districts 14 (Rep. Jason Zachary) and 89 (Rep. Justin Lafferty)—both anchored in the affluent western suburbs that swung toward Democrats—now sit at roughly R+11 and R+10, down from R+30 and R+32 in 2022.
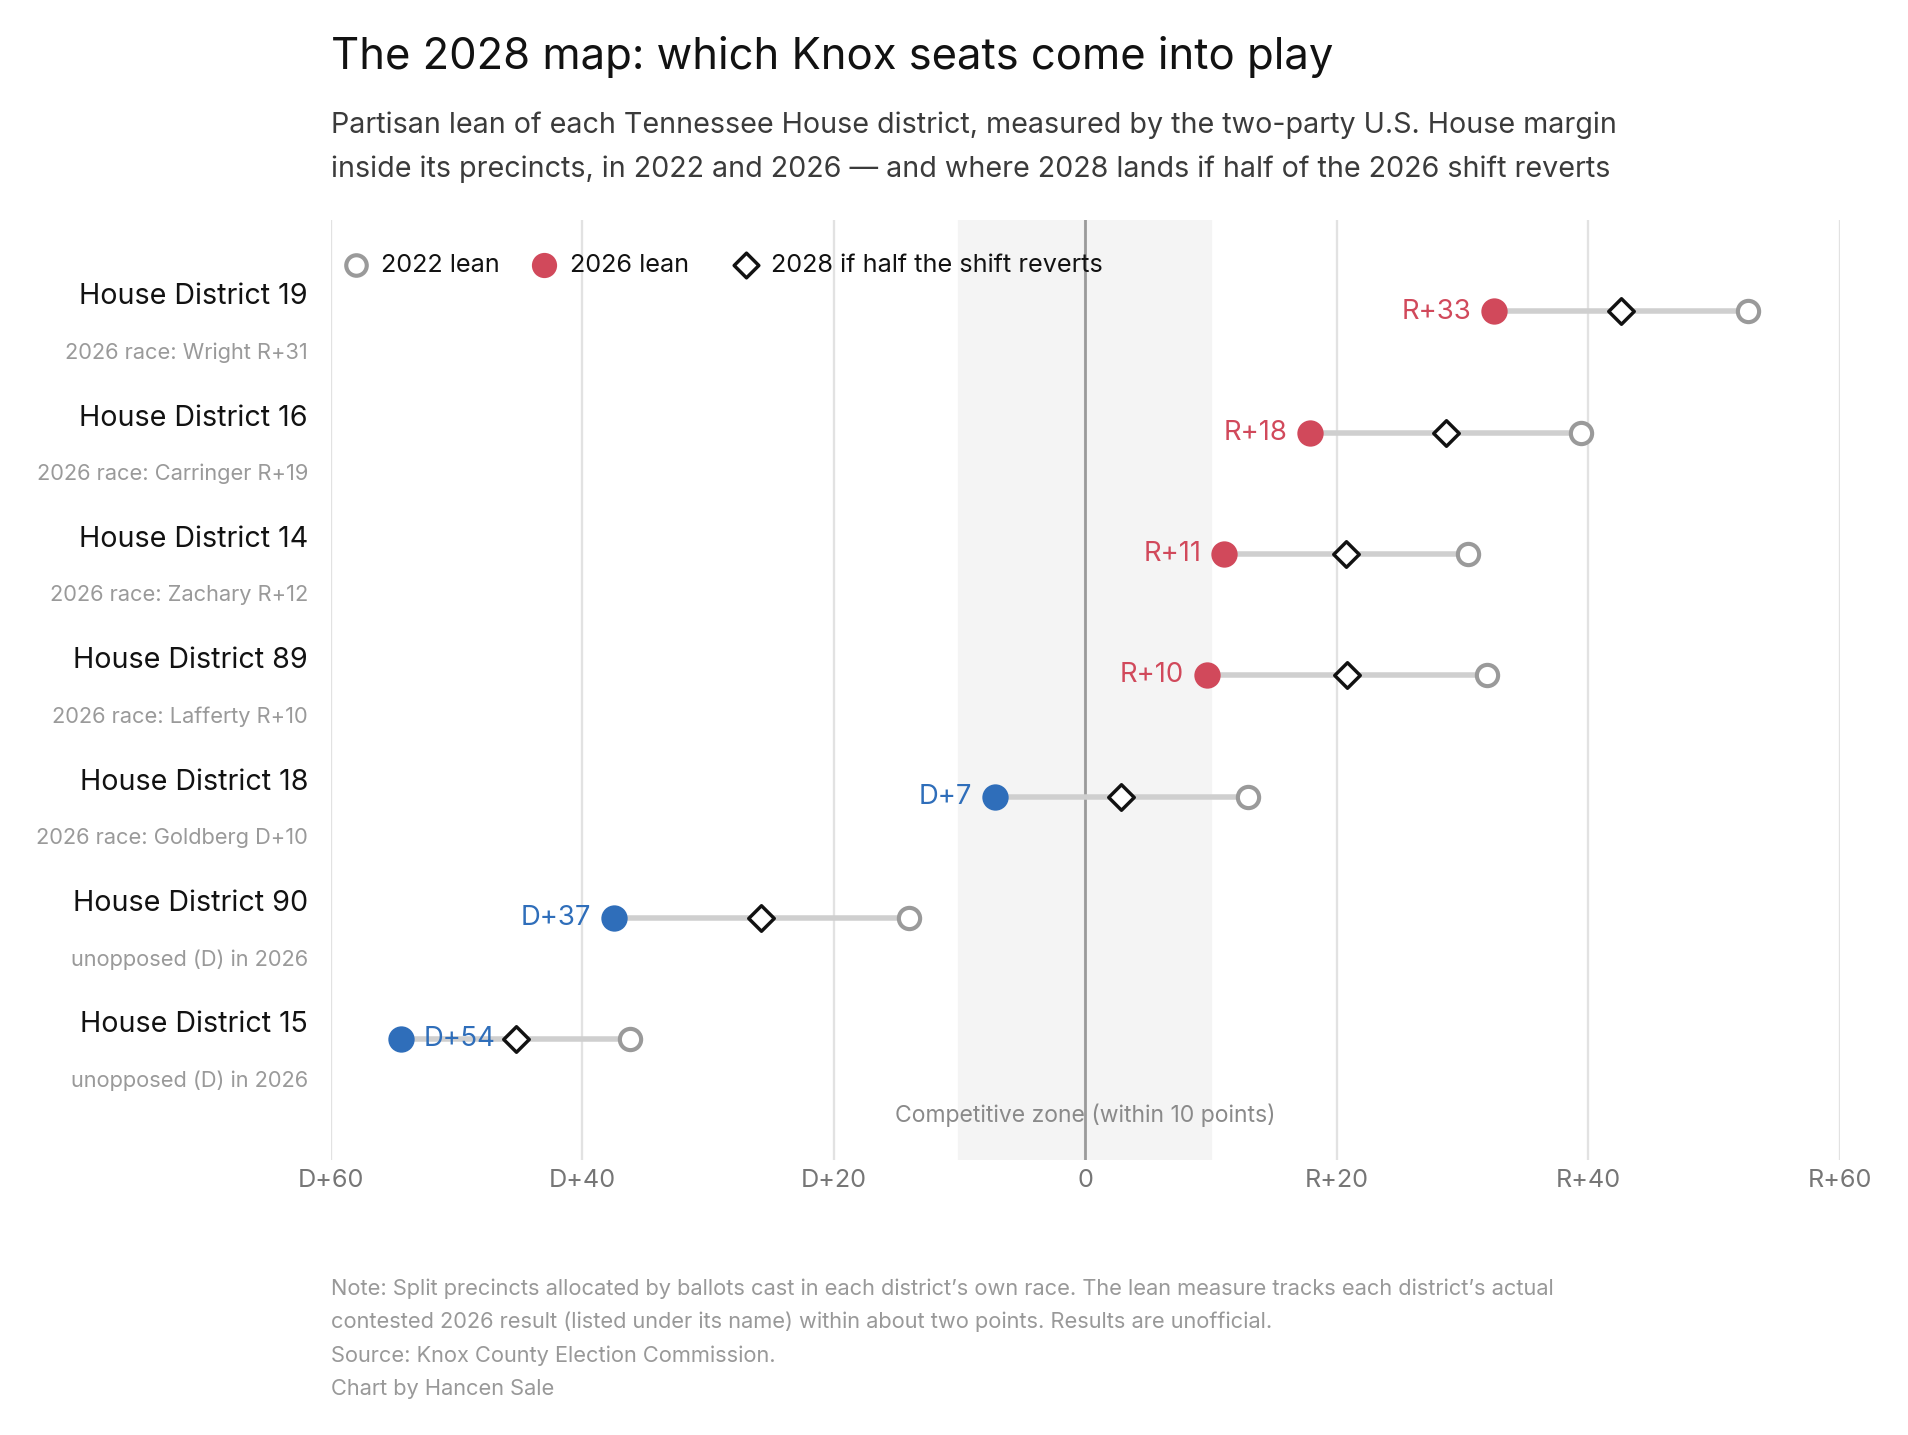
The diamonds mark a middle scenario: 2028 margins land halfway between the 2022 and 2026 results. If the 2026 environment persists into 2028, Districts 14, 89, and 18 are all genuine battleground districts with a marginal Republican advantage. If voting patterns revert halfway, District 18 becomes a pure toss-up (about R+3 on the underlying lean, against a Democratic incumbent), while 14 and 89 move to roughly R+21. If voting patterns revert all the way back to 2022 conditions, every Republican seat becomes safely Republican safe again.
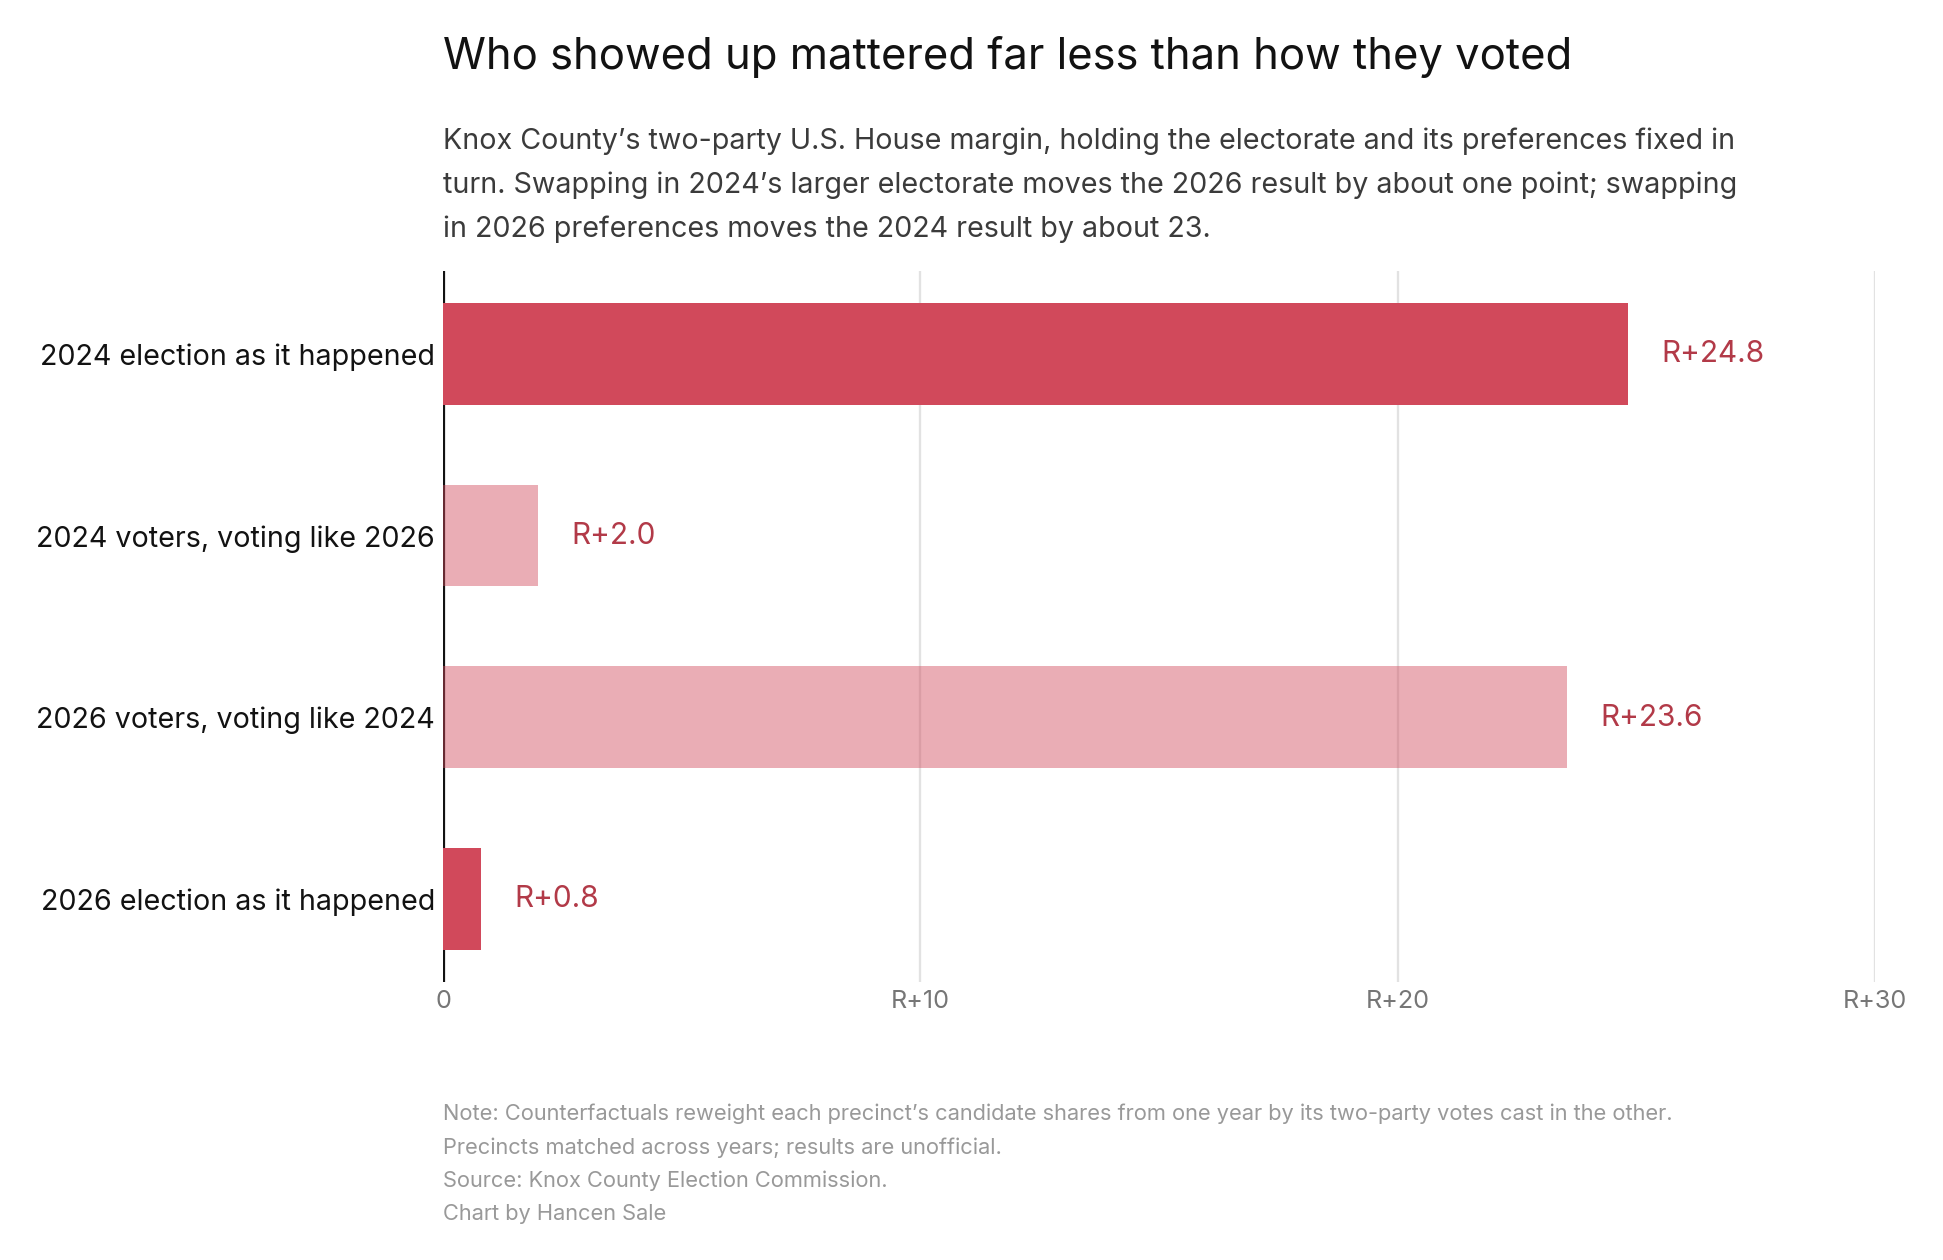
What if everyone comes back? Presidential year elections bring a much bigger electorate. The second analysis asks the obvious question about that: what would happen if you apply 2026 voter preferences to the larger 2024 presidential year electorate—and, the other way around, what 2024’s voting patterns would have produced with 2026’s smaller midterm?
The answer is stark. Apply 2026’s voting patterns to 2024’s much larger electorate and you get roughly R+2—very close to the R+0.8 that actually happened in 2026. Apply 2024’s voting patterns to 2026’s smaller midterm electorate and you get R+23.6—almost exactly the actual R+24.8 on 2024.
So What Does This All Mean?
The simplest way to read 2026 is through turnout. Democrats showed up at presidential-year strength: Michaela Barnett’s 76,885 votes in the U.S. House race amount to about 93% of what the party’s nominee drew in 2024, when a presidential race topped the ballot. Republicans showed up as if it were an ordinary midterm: Tim Burchett’s 78,125 votes almost exactly match his 77,873 from 2022—and just 57% of his own 2024 total. One party brought its presidential electorate to a midterm; the other left a big piece of its presidential electorate at home.
Each party leaves 2026 with one central question. For Democrats: was this the ceiling? The votes that powered Democratic gains in 2026 are, for the most part, votes the party has now found twice—in 2024 and again in 2026. The 2028 electorate will be far larger. So for Republicans, the question is: how many of their presidential-year voters return, and will they vote the same way they did in 2024?
Support My Work
This publication is free and publicly accessible to everyone.
That doesn’t mean it’s free to produce. Behind each article are real costs—from data subscriptions and software to research tools and analysis—and, to date, I’ve covered those myself.
If you find this work valuable, please consider making a donation of any amount. Every donation goes exclusively toward supporting and expanding this publication, not to benefit me personally. Your support helps keep this work free and accessible to all.
Valuable analysis. Thank you.