

A new report by the Federal Reserve Bank of Minneapolis sheds light on an important question: how many people actually own their home?
That may seem like a benign, simple question. Most people are used to seeing the “homeownership rate” cited in the news. If an area’s homeownership rate is 70%, it is natural to assume that 70% of the population are homeowners. Yet that assumption is incorrect.
The reality is more complicated—and a bit wonky. The answer is also a practical example of how similar statistics, designed to measure the same phenomenon, can lead to different conclusions. And oftentimes, the difference hinges on small methodological choices most readers never see.
Understanding homeownership data
Official estimates from the U.S. Census Bureau indicate the Knoxville metro area had a homeownership rate of ~71% in 2024. Most people understand that figure to mean that about 7 in 10 residents own their home. Yet that is not the case. This commonly cited metric actually reflects the owner-occupancy rate, which tell us what share of housing units are occupied by an owner. That is an important data point—particularly when measured over time—but it doesn’t answer the question the initial question: what share of the population owns their home?
Think about it this way. In 2024, the Knoxville metro area had a population of about 957,000. That population lives in roughly 395,000 housing units and consists of many different household types—including individuals, married couples, families with children, and so on. Not everyone in each housing unit is a homeowner. Some are renters. Some are roommates. Others are adult children living with their parents.
Here’s a thought experiment. Assume that (1) Knoxville’s homeownership rate is 100% and thus every housing unit is owner-occupied, and that (2) a given home can be “owned” by no more than two people. In that scenario, Knoxville could have no more than 790,000 homeowners (total housing units x2). Subtract that from the total population and that leaves roughly 167,000 people who aren’t classified as either homeowners or renters. As the homeownership rate is commonly understood, such individuals—whether they be adult children or roommates—are viewed as homeowners even though they do not actually own the home.
That’s the problem Minneapolis Fed research attempts to solve. To account for the disparity, the authors created what they refer to as the homeowners-to-population ratio, or HPOP, which measures ownership the population level.
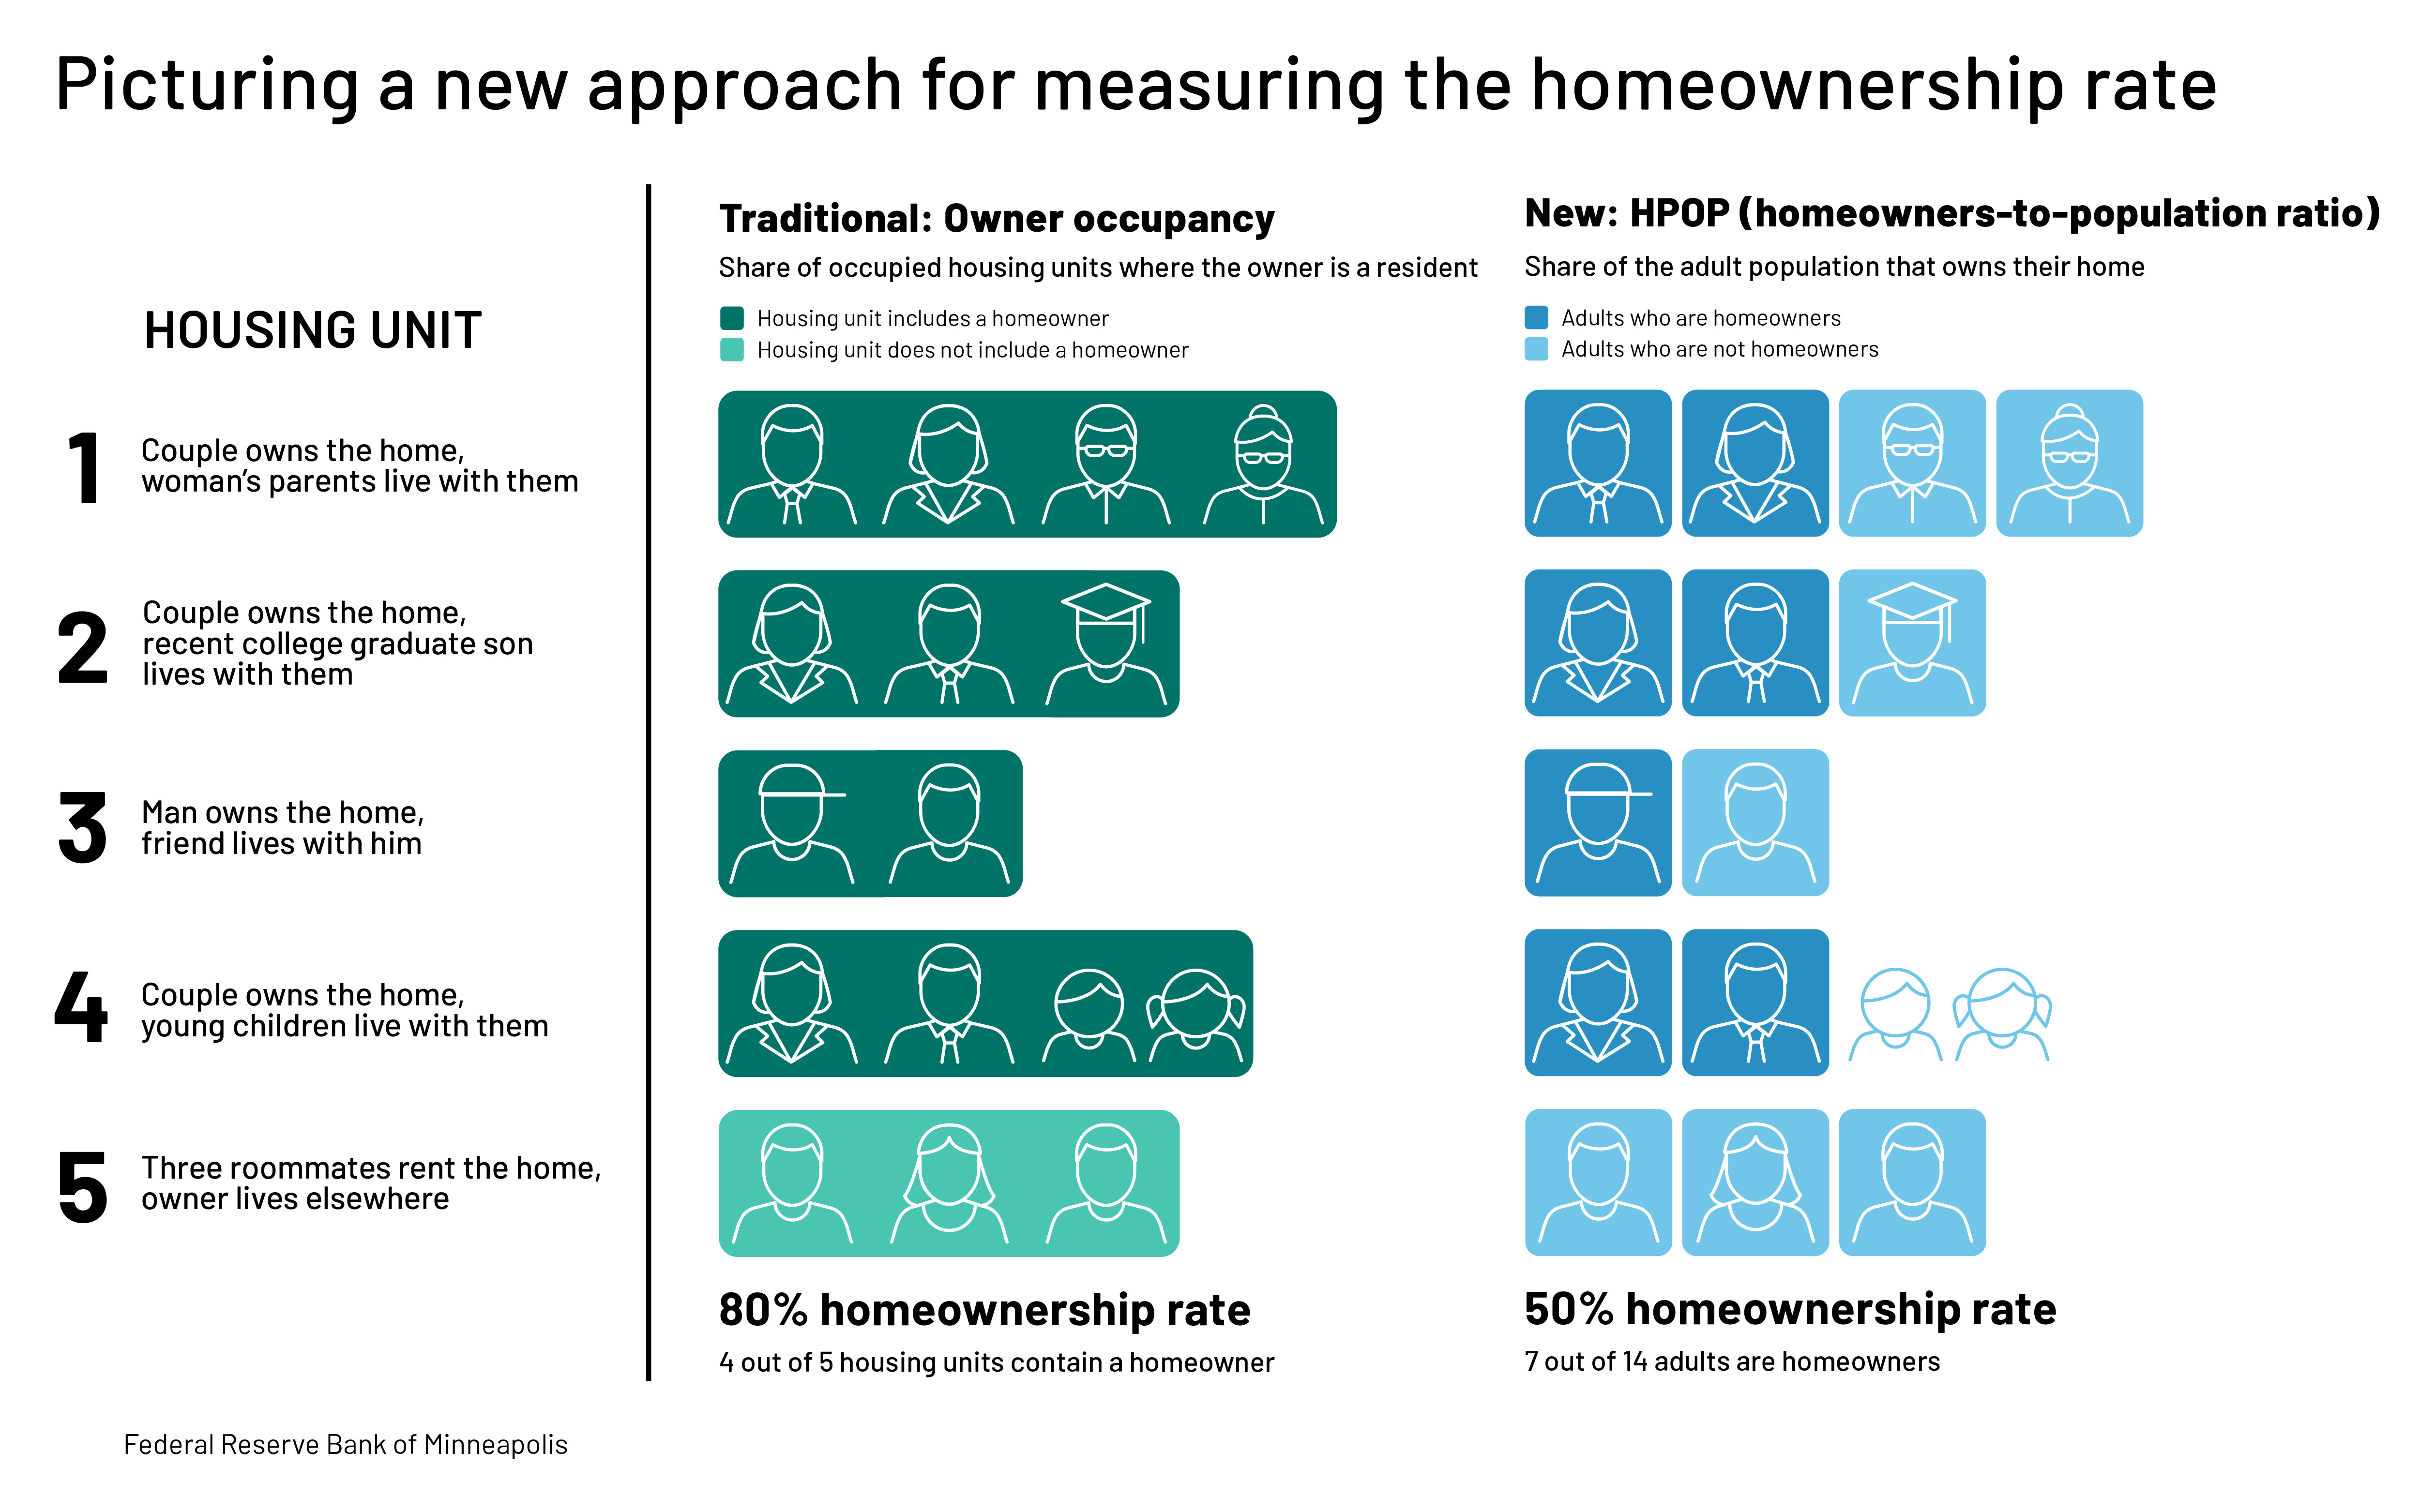
To better understand the difference between the traditional owner-occupancy measure and the HPOP, consider a hypothetical cul-de-sac with five housing units, each of which is home to a separate group of residents:
Housing unit 1. A couple owns their home. The woman’s parents live with them.
Housing unit 2. A couple owns their home. Their son, a recent college graduate, lives with them.
Housing unit 3. A man owns his home. A friend lives with him.
Housing unit 4. A couple owns their home. Their two young children live with them.
Housing unit 5. Three roommates rent their home. The owner lives elsewhere.
As illustrated in graphic below, these five housing units are home to 14 adults. Because 4 of the 5 housing units have their respective owners as residents, the owner-occupancy rate—the measure traditionally viewed as the homeownership rate—on the cul-de-sac is 80%. However, because only seven of the 14 adults are actually owners of the homes they live in, the homeowners-to-population ratio, or HPOP, is much lower, at 50%.
Source: New Homeownership Measure Puts People First (Federal Reserve Bank of Minneapolis, 2026).
Unlike the standard homeownership metric, the HPOP is based on individuals. It measures the total population of adult (18+) homeowners—including spouses and unmarried partners—by the total adult population, amounting to what can be considered the real homeownership rate. Unlike other metrics, the HPOP approach provides a more complete accounting of the adult population that does not own a home, including adults living in renter households or group quarters like military bases, nursing homes, or group homes. Crucially, it also includes adults who live in owner-occupied homes but are not owners themselves (e.g., adult children living with their parents; older parents living with their adult children; and other unrelated adults, such as friends or roommates).
Using the HPOP measure, the Minneapolis Fed found that homeownership is less prevalent than what is reflected in commonly-cited figures. In 2024, the U.S. homeownership rate was 65.3%—meaning 65.3% of housing units are occupied by their owner—yet the HPOP rate, or the share of the population that owns their home, was just 53.2%.
This 11.1 percentage point gap between the homeownership rate and HPOP is driven by the 13.9% of U.S. adults that live in owner-occupied homes but are not owners themselves—with adult children living with their parents being the largest group.
Applying the Homeowners-to-Population Ratio (HPOP) to Knoxville
For most of its history, Knoxville has been an owner-occupied town. Since 2005, the region’s homeownership rate has remained remarkably stable, rarely straying far from around 70%. It fell to a modern low of 67.1% in the wake of the Great Recession before recovering to a high of 71.9% in 2019; as of 2024, the latest year for which data are available, Knoxville’s traditional homeownership rate stood at exactly 71%.
Like in most other areas, Knoxville’s homeowners-to-population ratio (HPOP) suggests the traditional homeownership rate overstates homeownership at the population level. According to the Minneapolis Fed’s calculations, just 59.9% of adults in Knoxville MSA are homeowners—more than 11 percentage points lower than what the traditional rate reflects. In Knox County, the HPOP ratio is lower still, at 57% in 2024.
The HPOP methodology also allows for a more robust analysis of homeownership rates among young adults. Traditional homeownership rates for this age cohort are often inflated because young adults reside in non-typical households at a higher rate and are thus excluded from traditional calculations altogether.
According to Census data, the traditional homeownership rate for U.S. adults under age 35 was 37% in 2024. Using HPOP, which accounts for co-residents and dorm dwellers, that number falls to just only 22%. The same dynamic is at play locally. Census data from 2024 indicate that, in Knox County, the traditional homeownership rate among adults under age 35 was nearly 47%. When calculated using HPOP, however, that figure falls to just 25%—meaning only 1 in 4 young adults own their home.1
Peer Cities Comparison
Regardless of the measure used, homeownership is less common in Knoxville than in most other comparable metros. Knoxville ranks in the bottom third among peer cities for both the HPOP and the traditional owner-occupancy rate, although both measures remain roughly five percentage points above the national average.
More revealing than the 2024 figures, however, is how they have changed over the past decade. Across the peer city group, Knoxville and Huntsville stand out as clear outliers. On one hand, the two metros share several structural economic characteristics: both are anchored by federal research institutions and home to a major research university. Yet the two metros are on markedly different paths with respect to homeownership.
Each metro in the comparison saw its population-level homeownership rate increase between 2014 and 2024, with one exception: Huntsville, where the rate fell by more than four percentage points. That decline may seem surprising at first glance, especially given Huntsville’s exceptionally strong economy. Anchored by Redstone Arsenal, NASA’s Marshall Space Flight Center, and Cummings Research Park, Huntsville is one of the nation’s leading hubs for engineering, aerospace, and defense. Its STEM job market is strong and expanding, and, in part, why its early-career young professional base grew by 19% between 2019 and 2024—by far the strongest growth of any peer city.
But the key to understanding Huntsville’s declining homeownership rate is the interaction between its labor market and housing affordability. Home values in Huntsville increased by just 83% between 2014 and 2024—well below the peer average of 114%—and it has for years maintained the lowest rent burden, with an average rent-to-income ratio of just 18.5% in 2024 versus the peer average of 23.5%. Its relatively affordable rental market has helped attract young professionals seeking high-paying STEM jobs without the housing costs found in many other technology hubs. At the same time, comparatively affordable rents reduce the financial incentive to purchase a home immediately, with many newcomers choosing to rent while establishing their careers. In that sense, Huntsville’s declining homeownership rate is not necessarily a cause for concern and instead reflects, somewhat counterintuitively, the success of its economy in attracting a young, highly educated workforce.
Knoxville presents a markedly different story. Between 2014 and 2024, the typical home value increased by 140%—the second-largest increase among the peer metros, trailing only Nashville (143%) and well above the peer average of 114%. Moreover, Knoxville has lead the nation in price growth since 2020. Renters have also faced mounting affordability pressures in recent years. Knoxville experienced the largest increase in its rent-to-income ratio over the past decade, reaching 27.6% by the end of 2024—the highest among the comparison metros.2
Despite worsening affordability, however, Knoxville’s population-level homeownership rate increased by five percentage points from 2014 to 2024. That seems counterintuitive as conventional wisdom suggests rapidly rising home prices and rents should suppress homeownership. Much of the explanation lies in who moved to Knoxville during this period. In the wake of the pandemic, Knoxville experienced a surge in domestic migration. Many newcomers arrived with greater purchasing power, higher incomes, or accumulated home equity that enabled them to buy homes even as prices climbed.
The divergent paths of Knoxville and Huntsville, and the gap between the HPOP and the traditional owner-occupancy rate, illustrate the same underlying lesson: statistics are best understood with context. Huntsville’s falling rate and Knoxville’s rising one look like opposite stories, but they’re actually the same story told through the same lens—a lens that can’t distinguish between a young professional choosing to rent in a strong economy and a resident being priced out by newcomers with more money. The traditional homeownership rate wasn’t built to make that distinction. HPOP was. It’s also a reminder that no number or statistic, however official, tells you what it means without the context behind it.
Thank you for reading and supporting my work!
I write these articles as a free resource to help people and policymakers better understand the issues shaping Knoxville and East Tennessee through the lens of data. Behind each article are real costs—from data subscriptions and software to research tools and analysis—and so far, I’ve covered those myself.
If you find this work valuable, please consider making a contribution of any amount. All donations will be used exclusively to support and expand this publication.
Due to the nature of this analysis and the small sample size, I use the American Community Survey 5-year estimates rather than the 1-year estimates to calculate the HPOP ratio for Knox County residents under age 35. For smaller populations, year-to-year changes in the 1-year estimates often reflect sampling variability rather than meaningful underlying trends.
Change in the rent-to-income ratio is measured from 2015 to 2024 due to data availability.